NASA heatwave map reveals alarming rise in temperatures globally
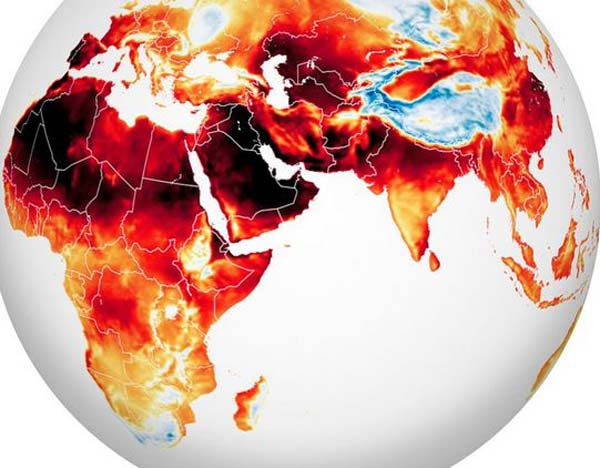
For many countries in Europe, North Africa, the Middle East and Asia, the months of June and July are proving to be testing the human heat endurance limit. The mercury has crossed 40 degree Celsius in many parts of the cities. Decades old records were broken. The map shared by Nasa of July 13, 2022 shows surface air temperatures over most of the Eastern Hemisphere. It was created by combining observations found in a version of the Goddard Earth Observing System (GEOS) global model, which uses mathematical equations to represent physical processes in the atmosphere.
Steven Pawson, president of the Global Modeling and Assimilation Office of NASA’s Goddard Space Flight Center, said, ‘There are clear patterns of atmospheric wave at different places. In this some areas are seen hot (red) and cold (blue). But large areas with extreme heat are evidence that greenhouse gases are increasing due to pollution being spread by humans, due to which the temperature is increasing continuously and people’s lives are being destroyed.


1976 map
Western Europe is reeling under drought, while many parts of Portugal, Spain and France are experiencing severe heatwaves. Red alert has been declared in UK. There were numerous fire incidents in Europe due to rising temperatures.
2022 map
In Italy on July 3, a section of the Marmolada Glacier in the Dolomites broke off due to record-breaking heat in Italy. Snow and rock avalanche killed 11 people In Iran, the mercury reached 52 degrees Celsius at the end of June. Whereas in China, due to the severe heat, the roads melted, the roof was broken and the humidity also became very high. NASA has released two maps, in which it has told how the earth’s appearance has deteriorated in the last 46 years. From 1976 to 2022, how the map of the earth turned from blue to red.